Dave Gerhardt's CMO Dashboard
How does former CMO and current Exit Five founder, Dave Gerhardt, report on marketing's performance to the exec team?
Watch Dave go over his dashboard:
What does this CMO dashboard include?
Dave Gerhardt’s CMO dashboard measures and reports on the following:
- Macro goal pacing: annual pipeline and new logo MRR
- Micro goal pacing: segment penetration, inbound pipeline, new logo MRR annual contract value
- Channel attribution using machine learning modeling
- Inbound drilldown: inbound performance and revenue by ICP segment, product, and region
- Marketing influence on sales velocity: qualification rate, sales cycle duration, annual contract value, win rate
- Brand Growth Index: brand aware traffic and brand aware buyers
- Current deals in pipeline
What insights can I surface with this dashboard?
Whether you’re a director, VP, or CMO, this dashboard will help you measure the performance of your marketing program and prove marketing’s contribution to executive leadership.
- How do quarterly goals influence annual goals?
- Where are leaks in our inbound sales funnel?
- What are the best channels for driving inbound new logo MRR?
- Where are we overspending on ineffective marketing?
- What are the early warning signs of pipeline and revenue decay?
- Who are our best fit buyers by product, region, and ICP
- What percent of pipeline and revenue is marketing sourced?
- How does inbound marketing influence sales velocity?
- How does brand health influence future buying behavior?
Dave Gerhardt’s CMO dashboard breakdown
How would Dave Gerhardt prove marketing’s contribution to revenue, get buy-in to scale channels that work, and report up to the executive team and board? Let’s find out!
Goal pacing at a glance
Every marketing leader has an annual revenue commit. But revenue isn’t a forward facing metric: you can’t influence revenue without influencing the steps that come before it.
So this dashboard features two sets of goals: macro goals and micro goals.
Macro goals represent your big, audacious annual goals like new logo monthly recurring revenue (MRR) and marketing-sourced pipeline. Micro goals represent the tactical decisions you’re going to deploy to hit them- in this case, increasing segment penetration, inbound qualified pipeline, inbound new logo MRR, and annual contract value.

At a glance, Dave uses this report to temperature check the marketing departments core KPIs and see whether or not he’s pacing on target (pacing indicated by the half circles with percentages).
Halfway through the quarter and only 34% of the way to your inbound qualified pipeline target? Time to adjust course.
Channel performance using machine learning
Next up: channel performance. This report used HockeyStack’s machine learning attribution modeling to measure funnel health for each marketing channel. Dave uses this report to identify which channels have the most impact on pipeline and revenue and which channels have leaks in the sales funnel.
Bonus: these reports break down performance at the account-level, not just user-level.
For example, it includes total sessions, but it also includes the number of accounts who make up those sessions (much smaller). Or it includes total leads, but it also includes the number of accounts who make up those leads (much smaller)
More specifically:
- Total accounts reached
- Total website sessions from accounts
- Engage accounts (# of accounts with sessions)
- Leads
- Converted accounts (# of accounts that turned into leads)
- MQLs
- Qualified accounts (# of accounts that turned into MQLs)
- Opportunities
- Pipeline
- Total won accounts
- Won MRR
How does our machine learning model work? In HockeyStack, you can filter through attribution models (first touch, last touch, multi-touch, time-decay, etc.) with one click. But our machine learning model uses statistical analysis to weigh touchpoints based on historical data.
Unlike first touch or last touch, ML attribution is not rule-based. We analyze both the converting and non-converting paths of previous customer journeys to pinpoint a touchpoints contribution with more precision. For example, if historical closed/won journeys travel through a specific channel or touchpoint but historical closed/lost journeys don’t, there’s a higher likelihood that touchpoint influences the buying process more than others- and therefore gets more credit in this model.

Marketing sourced leads and pipeline
Next up: marketing sourced SQLs and pipeline and ad cost per SQL and acquisition. First, “marketing sourced” means different things to different organizations. Good news: In HockeyStack, you can customize your own criteria.
In this example, Dave keeps it simple: “Marketing sourced” includes all SQLs and stage 3 pipeline generated from any marketing activities (paid and organic), and excludes outbound sales.
Why this matters: if sales needs to source 20% of their own SQLs and pipeline, then marketing needs to source the other 80%. But if marketing isn’t sourcing enough quality and volume, the revenue team is going to miss their target. At a glance, Dave can see if marketing is pulling their own weight.
Second, cost per SQL (paid) and cost of acquisition by channel (paid). Though most of this quarter’s marketing strategy focuses on inbound marketing, Dave knows that he needs to keep his ad CAC below a certain cost to make a profit, channel by channel.
Using a pie chart, he can visualize cost per SQL and ad CAC by all three channels he invests in: Google search ads, Facebook ads, and Linkedin ads.

Inbound channel performance drill down
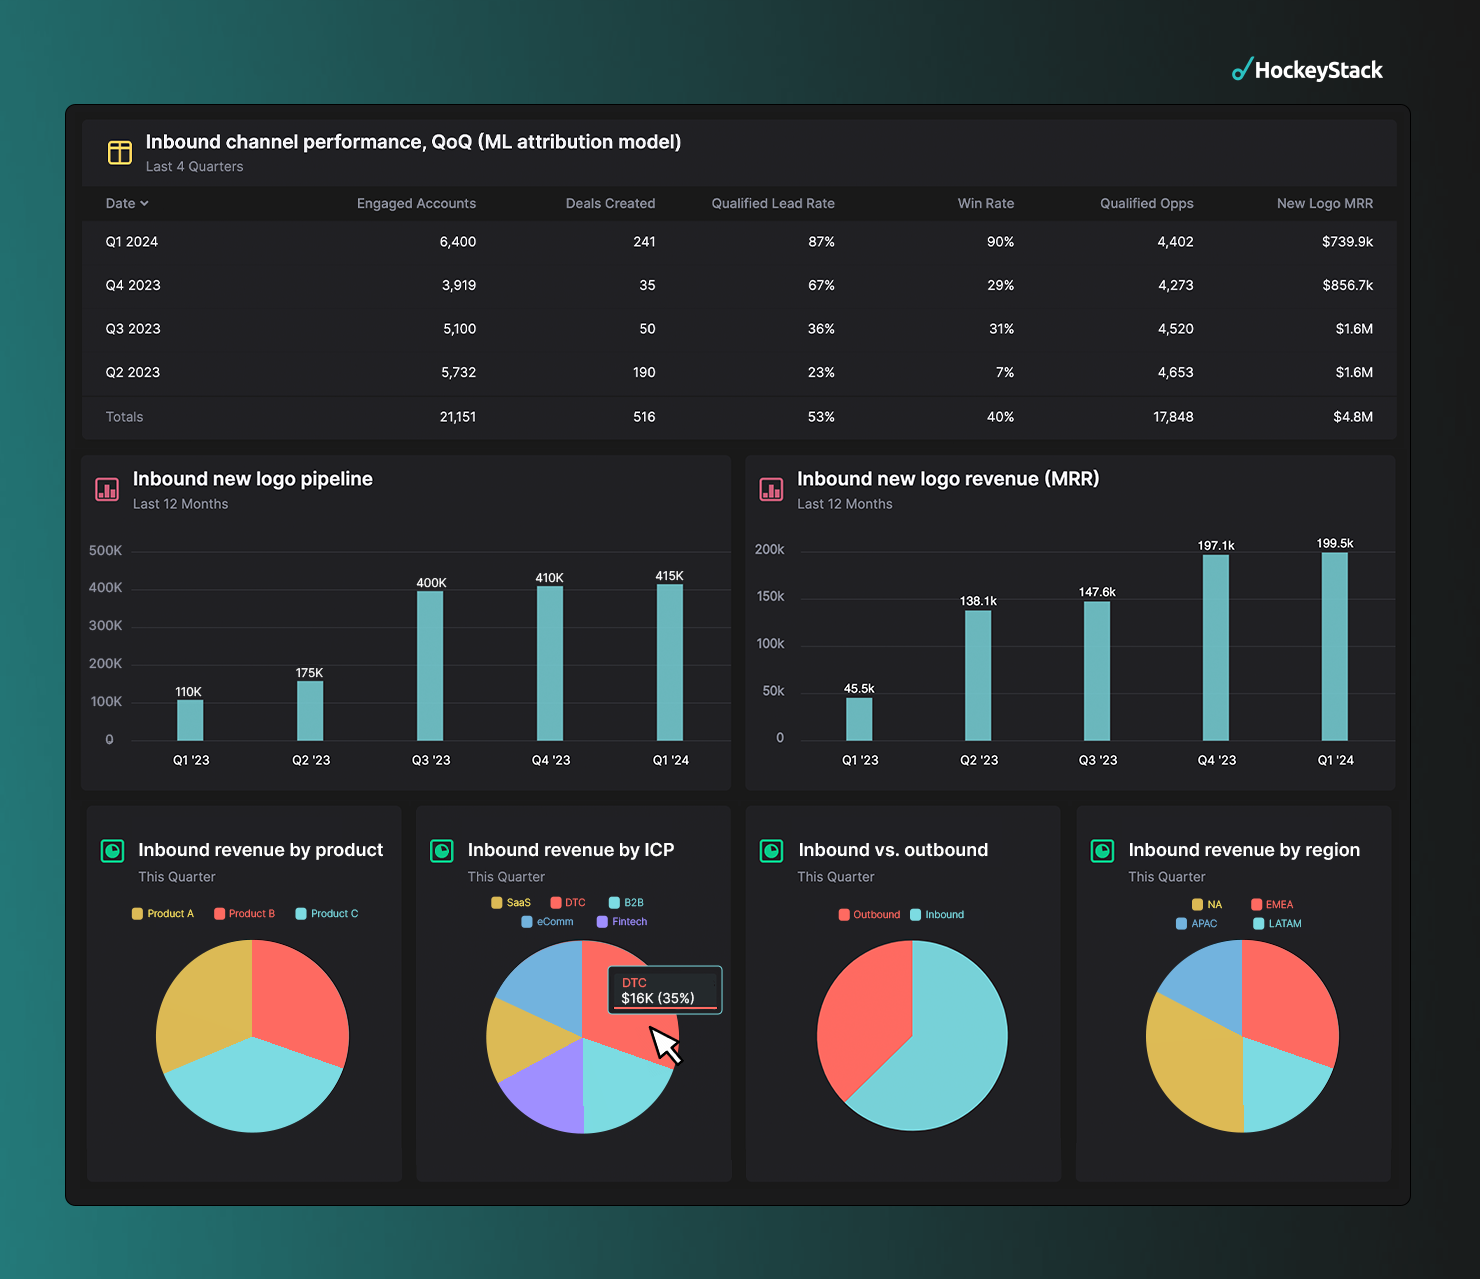
Since segment penetration, inbound pipeline, and inbound new logo revenue make up three of the four micro goals Dave’s marketing department has this quarter, the next section of the dashboard zooms in on them. First, quarter over quarter performance from all inbound channels combined, using the same ML attribution model from the last report. Second, inbound new logo pipeline and new logo MRR over a trailing 12 month time period, broken down by quarters. And third, inbound revenue by product, ICP, and region.
Not only can Dave gut check segment penetration by ICP, product, and region, but he can also analyze inbound growth the way executive leadership and the board want it: quarter over quarter.
If any of his core KPIs are trending in the wrong direction, this report will tell him.

Inbound influence on sales velocity
It’s marketing’s job to make sales easier, which makes sales velocity the perfect metric for measuring marketing’s ability to move buyers through the sales process faster. If you’re not familiar with sales velocity, the equation looks like this:
Opportunities x deal value x win rate ÷ sales cycle duration = sales velocity
You can (and should) measure sales velocity broadly, but in HockeyStack, we have a better way of estimating the incremental contribution marketing makes on sales velocity: segmentation. For example, in the report below, we’ve segmented all inbound buyers from everyone else, then compared the two group’s annual contract value, sales cycle duration, qualification rate, and win rate.
The result? Inbound marketing’s incremental contribution to sales efficiency.
In the case below, buyers who came inbound as opposed to outbound converted into sales qualified opportunities at a higher rate, spent more money (annual contract value), moved through the sales process faster, and closed at a higher rate. Now that Dave can prove Inbound’s measurable lift on sales efficiency, he can use this data to secure buy-in and funding for more inbound programs.

Brand Growth Index
The marketing leader needs to balance short-term, rapid growth with long-term, sustainable growth. To do that, it requires visibility into long-term brand effects.
We call this the Brand Growth Index, and it answers two questions: Are you reaching and influencing future buyers while they sit out-market (branded search traffic, direct traffic, product name search traffic, and homepage organic traffic)? And do people who discovered you through those channels turn into buyers in the future?
If your brand marketing is reaching and influencing future buyers in advance of purchase, the answer to both of those questions should be yes. In HockeyStack, you can prove it.
Using the report below, Dave can see that his brand is growing, as evidenced by the steady growth of branded traffic (in B2B, how many strong brands are built without people visiting a website? Likely none). But he can also see that his brand activity is producing future pipeline and revenue, as evidenced by the number of won deals who come from that branded traffic.
Together, Dave can see that his brand activity is creating awareness and revenue.

Marketing and sales time lag
Most of the impact this quarter’s marketing has on revenue won’t be realized for two to three quarters down the road. This time lag has created more division, misalignment, frustration, and poor decisions than any other factor in marketing. Good news: without needing sophisticated data modeling, you can leverage attribution data to estimate time lag with a high degree of confidence.
In HockeyStack, we measure the days between the first time someone visited your website to the time they turned into a paying customer to approximate marketing time lag.
In the example below, it takes a new buyer 167 days between touching Dave’s website and converting into a paying customer. And of those 167 days, 21 of them, on average, are spent in the sales process.
So when leadership comes to Dave and asks him to drum up more pipeline this month, he can build a data-backed case for why that’s not feasible.

Average marketing touchpoints
This one is simple: how many marketing touchpoints, on average, does a closed/won account engage with?
You can customize touchpoint calculation in HockeyStack based on sessions (each page view is considered a touch) or unique visitors (one visit is considered a touchpoint, no matter the pages viewed).
In this example, touches are broken down by sessions: if someone visited your website from an ad (1), viewed four pages (4), came back through organic and viewed the homepage plus three more (4), then converted, you’d have 9 touchpoints. Note: touchpoints include all touchpoints from all members of the account, not just one, hence the high volume.

Current deals in pipeline
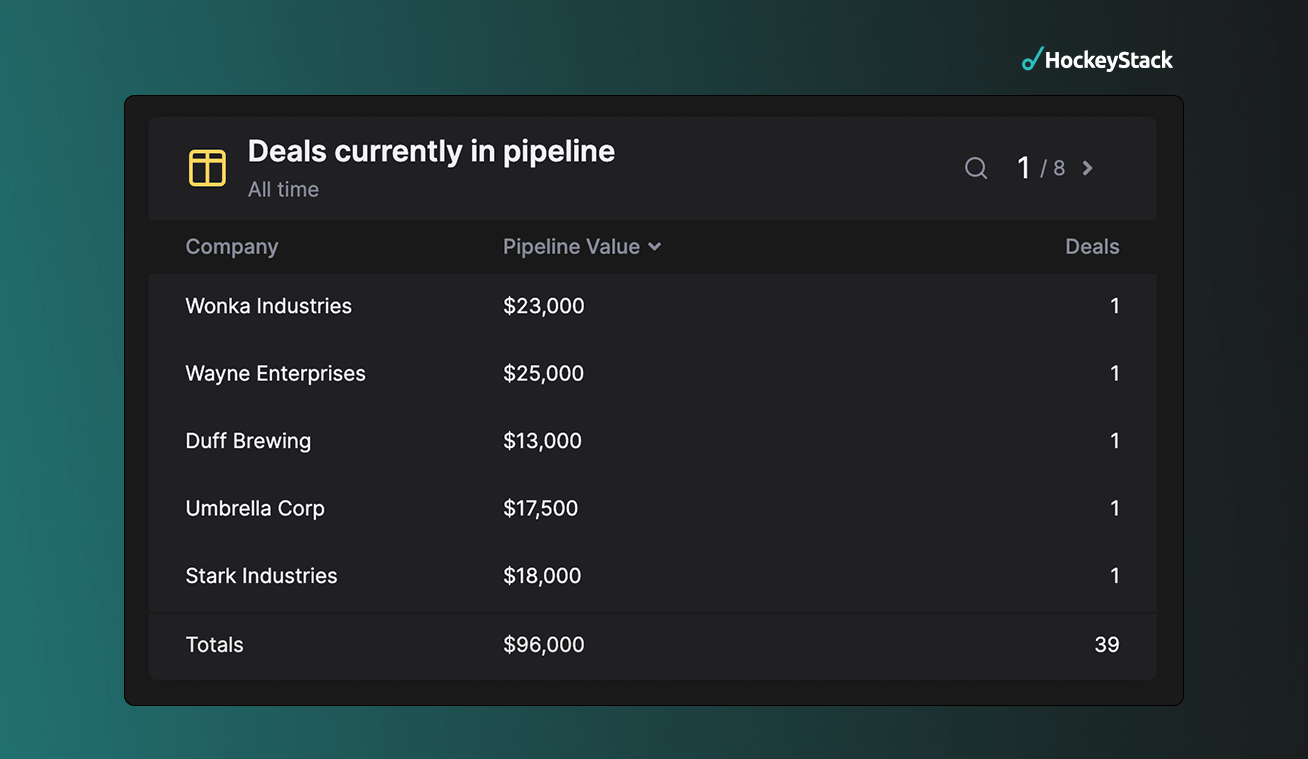
And last, what companies are currently in the sales pipeline? Using the table below, Dave can see which companies are currently in the sales pipeline and how much potential revenue they represent.
Bonus: if he clicks on any one of the companies, he can drill down into each company’s account-level customer journey and see which marketing activities they encountered on their way to booking a demo.

Learn more about how HockeyStack helps marketing, revenue, and sales teams surface and action insights like the ones in this template by exploring the interactive demo or booking a virtual demo.

About the Marketer:
About: Dave Gerhardt is the former CMO of Privy, former VP of Marketing and Chief Brand Officer at Drift, and current founder of Exit Five, a B2B marketing community with over 3,000 members.
Website: ExitFive.com
Connect on Linkedin: Dave Gerhardt
.png)

.png)