Carbon Brief Staff
20.10.2014 | 8:40amOceans cover more of the planet than anything else. So it makes sense that we need to know what’s happening to them to understand how humans are changing the climate.
If you follow climate science, you’d be forgiven for being a little confused recently by different news reports suggesting the oceans are warming , slightly cooling or doing nothing at all.
So are the oceans hotting up or aren’t they? And how does what happens beneath the waves influence what we feel up here on earth’s surface? Here’s our top to bottom look at the oceans and climate change.
More heat in, less heat out
Scientists have known for centuries that greenhouse gases in the atmosphere, such as carbon dioxide and methane, trap heat and warm the planet. This is known as the greenhouse effect.
Scientists use satellite measurements to monitor how much of the sun’s energy enters earth’s atmosphere. A different set of measurements tells them how much finds its way out again.
The difference between those numbers is increasing, which means the earth is trapping more heat than it used to. And that means the planet must be warming.
A hiatus in surface warming
An interesting question is why temperatures at earth’s surface – that’s the air above land and the very top of the ocean – don’t always reflect what’s happening to the planet as a whole.
Over the last 15 years or so, surface temperatures have risen much slower than in previous decades, even though we’re emitting greenhouse gases faster than we were before.
This is what’s become known as the “hiatus”, “slowdown” or even “pause” in surface warming.
This raises an obvious question. If earth is gaining heat but the surface isn’t warming very much, where is the heat going instead?
Where does the heat go?
The scientific literature is full of discussions about where the extra heat might be ending up.
We tend to be most interested in what temperatures at earth’s surface are doing, because that’s where humans live.
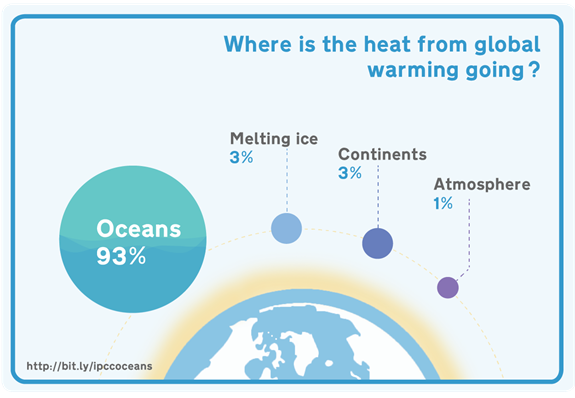
But actually only about one per cent of trapped heat stays in the earth’s atmosphere.
As the oceans absorb more than 90 per cent of the heat the planet traps, it makes sense to begin looking there for explanations of the changes we’re seeing at earth’s surface.
Looking to the ocean
Scientists have been taking the oceans’ temperature for centuries – from the days of dipping a thermometer into a bucket of water beside a ship, to the satellites that now encircle the globe.
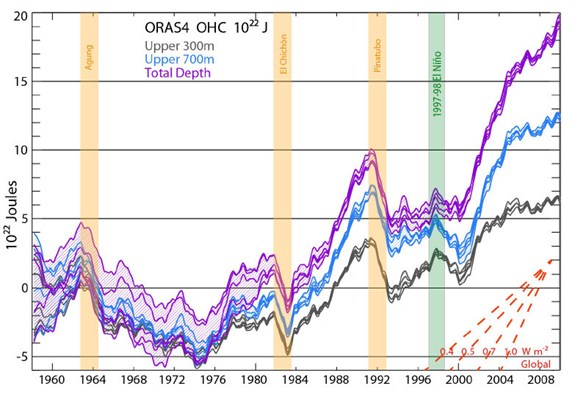
The coloured lines below use all the data scientists have available to show how the total amount of heat stored in the oceans changed between 1958 and 2009.
The blue lines are the surface down to 700 metres – this is generally referred to as the “upper ocean”. You can see a warming trend starting in about 1975, punctuated by short, sharp cooling after major volcanic eruptions and the massive El Niño in 1998.
But since about 2005, the pace of upper ocean warming has slowed quite a bit – especially in the top 300m, shown by the black lines.
How the amount of heat in the oceans changed between 1958 and 2009. Top 300m (black), top 700m (blue) and total depth (purple). Source: Balmaseda et al., (2013)
While warming has been slowing down in the upper ocean, it’s been speeding up in other parts. That means the oceans as a whole – shown by the purple line – are warming.
More heat is finding its way to the deep ocean instead of staying near the top. You can see this in the chart above – the gap between the purple line (whole ocean) and the blue line (top 700m) is wider now than it was in the early 2000s.
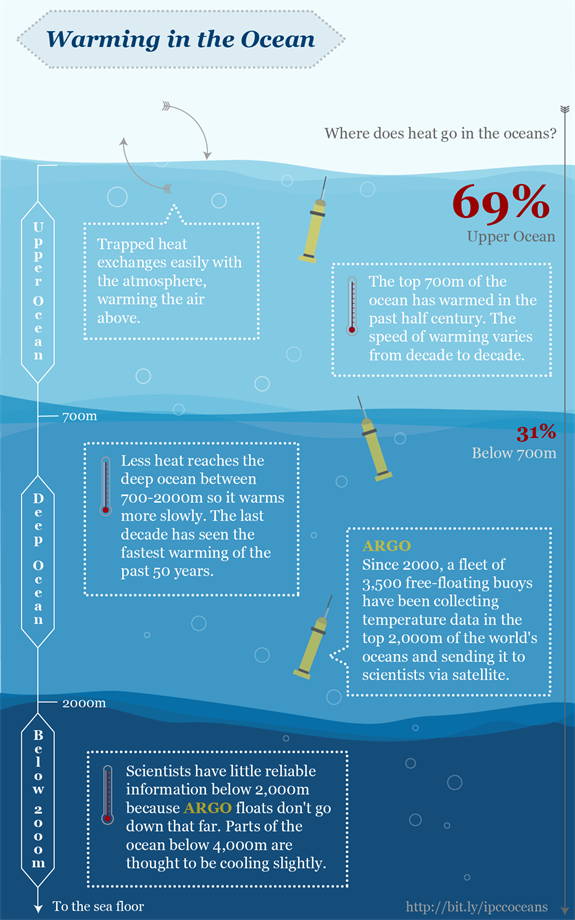
In fact, the data show the deep ocean – between 700m and 2,000m – is now warming faster than at any time in the last 50 years.
Why does it matter where the heat goes?
Winds constantly stir the upper ocean, keeping it very well mixed. Heat stored in the upper ocean passes easily into the layer of air above it, warming it up. This is what happened for most of the 1990s, causing surface temperatures to rise very quickly.
Since the early 2000s, more heat has been pushed deeper into the ocean. That means the air above has warmed less, explains the University of Reading’s Professor Richard Allan:
“[M]ore of the heating due to rising greenhouse gas concentrations is being buried below the upper ocean layers, depriving the atmosphere of this extra ocean warmth.”
How do scientists know this?
Monitoring the seas became a lot easier in about 2000 with the advent of ARGO – a network of free-floating buoys measuring temperature in the top 2,000m of the world’s oceans.
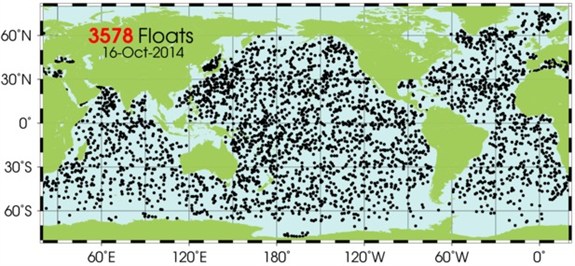
As of 16th October 2014 there are around 3,600 free-floating ARGO buoys traversing the oceans monitoring temperature and salinity in the top 2,000m. The image above shows only buoys that reported in the previous 30 days. Source: ARGO programme
Argo has provided scientists with a wealth of new data, on top of the measurements from ships and satellites. But estimates of ocean warming still come with a fair bit of uncertainty.
There are few ARGO floats in the Arctic and Indian Oceans, for example. The Arctic is warming almost twice as fast as the global average and poor data there is likely to pull estimates of global average surface warming down by several tenths of a degree.
So it could be that the upper ocean has been taking up more heat than we thought. Not much data existed in the Southern Ocean before ARGO, which scientists think could mean warming there has been underestimated. But since the data is imperfect, it’s hard to say whether warming right across the global ocean can fully explain the hiatus.
But the warming in the top 2,000m of the ocean in the past decade agrees pretty well with the increase in the amount of heat being trapped by greenhouse gases in the atmosphere.
Into the abyss
Recent research suggests water below 2,000m isn’t showing signs of warming. Below about 4,000 m – known as “the abyss” – the ocean may even cooling slightly.
But since ARGO floats don’t go deeper than 2,000m, reliable data that far down is scarce.
Scientists can use the fact that water expands as it warms to infer temperature changes at these depths. But estimating warming this way comes with quite a bit of uncertainty.
A new project, “Deep Argo“, hopes to rectify this, with a similar network of floats to monitor the ocean down to 6,000m deep.
Oceans apart
Knowing that heat is finding its way to the deep ocean is only part of the puzzle.
Scientists want to know why it’s happening, how long it will last and whether it’ll happen again in future.
The tropical Pacific seems to hold the key. Trade winds have been particularly strong since about 2000, which scientists think could be driving heat deeper and bringing cooler water up.
Scientists say this mechanism could mean earth’s average surface temperature is 0.1 to 0.2 degrees cooler than it would otherwise be, which is enough to account for much of the hiatus.
Not all scientists agree, however. Other research suggests a slow-moving fluctuation in the Atlantic is driving slower surface warming, rather than wind-related events in the Pacific.
The world’s oceans are all connected and unravelling their separate influences is complicated. While most scientists who work in this area suggest there could be an additional role for the Atlantic in driving the hiatus, evidence for the Pacific Ocean mechanism is winning out.
How long will the hiatus last?
Scientists think the strengthening of the Pacific trade winds is driven by a larger natural cycle called the Interdecadal Pacific Oscillation (IPO) cycling from its warm to its cold phase.
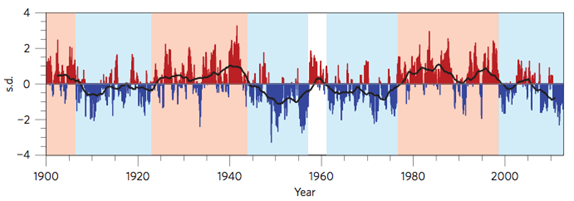
Changes of pace in surface warming aren’t unusual. Earth’s surface temperature record is full of speed-ups and slow downs. Past hiatus periods have coincided with the IPO’s cool phase.
Black curve is earth’s surface temperature with rising global average removed. Red and blue colours are PDO positive (warm) and negative (cool) phases. Source: Trenberth et al., (2014)
This implies the current hiatus will last until the IPO shifts back in the other direction. Professor Matthew England of the University of New South Wales concludes in a recent paper:
“This hiatus could persist for much of the present decade if the trade wind trends continue, however rapid warming is expected to resume once the anomalous wind trends abate”.
It follows that we could see more hiatus periods in the future each time the PDO flips to its negative phase. Likewise, we’d expect to see rapid warming during its positive phase.
But if the rate at which we’re emitting greenhouse gases continues to pick up pace, we’ll barely be able to detect these hiatus periods in coming decades. That’s because the deep oceans may not absorb heat quickly enough to stop earth’s surface from warming, explains a paper by Nicola Maher of the University of New South Wales:
“Under high rates of greenhouse gas emissions there is little chance of a hiatus decade occurring beyond 2030, even in the event of a large volcanic eruption.”
What else could be slowing surface warming?
Scientific evidence is building that the deep ocean is behind slower surface warming, and that the pace of surface warming will pick up again when the natural cycles that control it reverse. But a couple of other things may be contributing too.
Scientists think a slightly weaker sun in the 2000s compared to the 1990s could mean we’re seeing slightly less warming than in previous decades. An increase in the amount of particles in earth’s stratosphere that reflect sunlight, known as aerosols, may be playing a part too.
But both of these effects are small. The drop in solar activity and higher aerosols mean surface temperature is about 0.07 degrees cooler than it would otherwise be. Other work suggests the aerosol effect could be bigger, but ocean warming is still seen as the main player.
One important implication of this would be that the hiatus in surface warming doesn’t mean carbon dioxide warms the planet warms less than scientists thought. If the heat is just finding its way to a different part of the climate system, climate sensitivity remains unchanged.
Rearranging heat
As the biggest absorber of heat, it make sense that understanding climate change should mean understanding the oceans.And the oceans aren’t an amorphous blue blob. Piecing together what’s happening at different depths and in different parts of the globe is critical.
The hiatus is likely to be a product of several factors, each carrying its own uncertainties. Unravelling how different influences compare will take some time yet – if it’s possible at all.
There are still gaps in scientists’ knowledge of how the climate system behaves in response to greenhouse gases, and how natural factors alter that behaviour from one decade to the next.
But the bottom line is that understanding what’s happening to surface temperatures means focusing not just on the parts of the climate system we’re most familiar with, but also on how the earth rearranges heat out of sight.
Updated 21st October - Added a note to explain that the ARGO map shows only buoys that have reported in the past 30 days.


