Microsoft Excel, a popular spreadsheet program from Microsoft is extremely important for businesses, analysts, and professionals in many industries. It helps manage, analyze, and show data, making Excel skills very valuable making it favored by top companies like JPMorgan Chase, KPMG, Deloitte, and PwC for its simplicity and powerful features.
In this article, we will look at the 50+ Excel Questions And Answers perfect for both Freshers and experienced professionals. These interview questions are also helpful for individuals who are preparing for roles such as data analysts, business analysts, and accountants. These Excel Interview Questions cover everything about Excel 365, from the basics to advanced formulas, VBA, macros, and more.
Common Excel Interview Questions
This section focuses on excel related interview questions designed to evaluate your ability to apply Excel creatively and effectively in real-world scenarios. These questions assess your skills in using complex formulas, tools like PivotTables, and integrating Excel with other software to solve business problems.
1. Describe a creative way you used Excel to solve a problem at work.
In a logistics project, I created a heatmap using conditional formatting to visualize delivery delays by region. This helped the team quickly identify high-risk areas and allocate resources more effectively, reducing delays by 20%.
For a reporting task, I exported data from Salesforce into Excel for advanced analysis. I used Power Query to clean and transform the data and then generated dynamic dashboards with pivot tables and charts, providing actionable insights for the sales team.
3. How do you prioritize tasks in Excel when working on multiple datasets or projects?
I organize my tasks by creating a to-do list in Excel with priority levels using drop-down menus. I also use color-coded conditional formatting to highlight deadlines and progress, ensuring I focus on the most critical datasets first.
4. How do you use Excel for decision-making or forecasting?
I use Excel’s FORECAST and TREND functions to predict sales growth based on historical data. Combined with scenario analysis using What-If Analysis, I present stakeholders with potential outcomes to support informed decision-making.
I created a KPI tracker in Excel with dashboards that visualized sales, revenue, and customer retention. Using pivot tables and slicers, I allowed managers to filter metrics by region or timeframe, providing real-time performance insights.
Beginner Level Excel Interview Questions
This section covers basic Excel questions commonly asked in interviews, especially for freshers. These Excel Interview Questions and Answers for Freshers focus on fundamental concepts and essential functionalities of MS Excel. Mastering these basics is crucial for anyone starting a career in data analysis or business roles.
1. What is Excel used for?
Excel is a spreadsheet program used for data organization, analysis, and visualization. It provides many features such as:
- Performing Complex Calculations with the help of built-in functions such as COUNTIF, SUM etc.
- Creating charts
- Creating Graphs for Data Visualization and more.
2. Explain the difference between a workbook and a worksheet.
- A workbook is a spreadsheet program file that you create in Excel. A workbook contains one or more worksheets.
- A worksheet consists of cells in which you can enter and calculate data. The cells are organized into columns and rows.
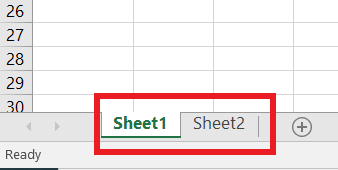
3. How do you navigate between worksheets in a workbook?
Use sheet tabs at the bottom of the Excel window.
 MS Excel
A cell address in Excel is the unique identifier for a specific cell in a worksheet, formed by combining the column letter and row number. For example:
- A1: Refers to the cell located in column A and row 1.
- B5: Refers to the cell located in column B and row 5.
5. Explain the difference between a relative and an absolute reference in a formula.
Relative Reference | Absolute Reference |
|---|
- A relative reference changes when the formula is copied.
| - An absolute reference remains fixed.
|
- It adjusts with the movement of Rows and Columns.
| - It does not adjust with the movement of Rows and Columns
|
- Useful for applying same formula across multiple cells.
| - Useful for referencing a specific cell that should not change.
|
- If the original formula in A1 is "
=B1+C1" and is copied to A2, it gets adjusted to "=B2+C2"
| - If the original formula in A1 is "
=$B$1+$C$1" and copied to A2, it remains as "=$B$1+$C$1".
|
The order of operations in Excel formulas is
- Parentheses
- Exponents
- Multiplication and Division (left to right)
- Addition and Subtraction (left to right).
| Aspect | Formula | Function |
|---|
| Definition | A formula is a user-defined expression that performs calculations using operators and references. | A function is a pre-built operation in Excel designed to perform specific tasks. |
| Creation | Created manually by the user using operators like +, -, *, etc. | Predefined in Excel, called by entering the function name (e.g., =SUM, =AVERAGE). |
| Examples | =A1+B1-C1 | =SUM(A1:A10) or =IF(A1>10, "Yes", "No") |
| Complexity | Can range from simple to complex based on user-defined logic. | Often simplifies complex operations into single commands. |
| Flexibility | Fully customizable and can include functions. | Limited to the structure and purpose of the predefined function. |
| Purpose | Performs basic or custom calculations. | Simplifies repetitive or complex tasks with predefined logic. |
| Ease of Use | Requires manual entry and logic setup. | Easy to use with predefined syntax and arguments. |
8. How do you create a chart in Excel?
Select data you want to include, go to the "Insert" tab, and choose a chart type.
 MS Excel Toolbar
It's formatting applied based on specified conditions. To apply conditional formatting, select a category, go to "Home" > "Conditional Formatting."
 MS Excel Toolbar
10. Explain the VLOOKUP function.
VLOOKUP is a function in Excel that searches for a value in the first column of a range and returns a value from the second column in the same row.
VLOOKUP Function: =VLOOKUP(lookup_value, table_array, col_index_num, [range_lookup])
11. Write a Formula for the given case: Multiply the value in cell B5 by 50, add the result by 10, and divide it by 2.
The formula to perform this calculation in Excel would be: = (B5 * 50 + 10) / 5
This formula multiplies the value in cell A1 by 10, adds 5, and then divides the total by 2.
The formula is: =IF(B1 > 50, "Pass", "Fail")
This formula evaluates the condition B1 > 50 and returns "Pass" if true, or "Fail" if false.
13. Combine the first name in cell A1 and the last name in cell B1 into a full name.
The formula is: =A1 & " " & B1
Alternatively, using the CONCATENATE function: =CONCATENATE(A1, " ", B1)
14. How will you Highlight all cells in the range F1:F10 that are greater than 100?
Highlight all cells in the range F1:F10 that are greater than 100.
- Select the range F1:F10.
- Go to the Home tab → Conditional Formatting → New Rule.
- Select "Format only cells that contain."
- Set the condition: Cell Value > 100.
- Choose a format (e.g., fill color), and click OK.

For a deeper understanding of the basics, refer to our MS Excel Tutorial, which covers essential concepts and practical examples to help you master the fundamentals.
This section focuses on excel questions asked in interviews for intermediate-level roles. These excel job questions test your ability to handle more advanced Excel features, including data analysis tools and complex formulas, making them essential for excelling in professional roles.
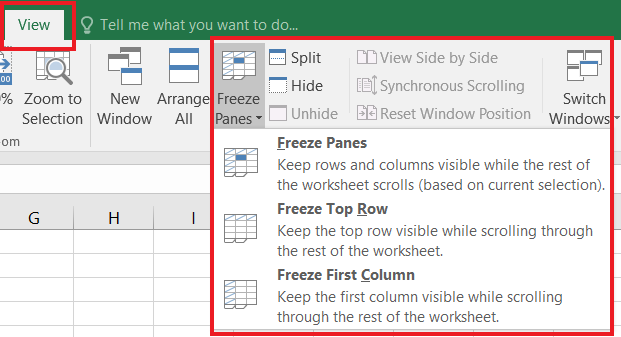
15. How do you freeze panes in Excel?
Go to the "View" tab, select "Freeze Panes," and choose an option.
16. What is the CONCATENATE function used for?
The CONCATENATE function combines two or more text strings into one string.
CONCATENATE Function: =CONCATENATE(text1, text2, ...) or =CONCAT(text1, text2, ...)
17. How can you remove duplicates in Excel?
Select the range, go to "Data" > "Remove Duplicates."

18. What is the difference between CONCATENATE and CONCAT functions?
CONCAT is a new function that replaces CONCATENATE, providing additional features.
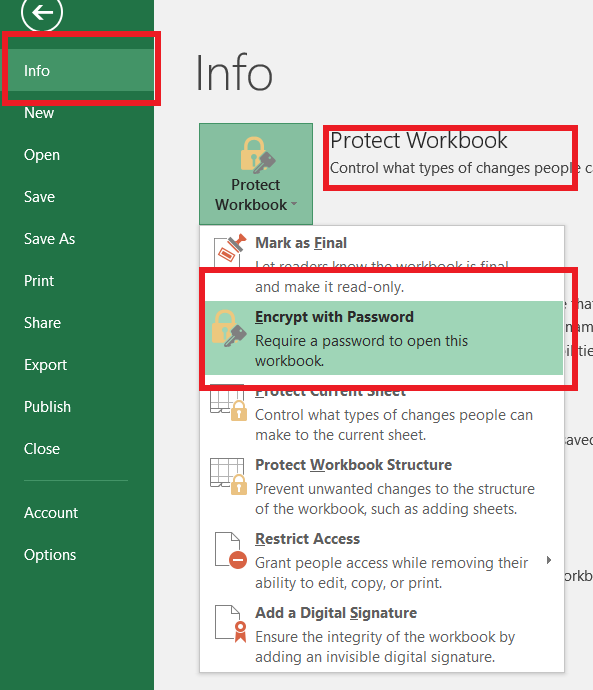
19. How do you password-protect a workbook?
Go to "File" > "Info" > "Protect Workbook" > "Encrypt with Password."
20. How to Create a Pivot Table in Excel?
Creating a Pivot Table in Excel allows you to summarize, analyze, and organize data efficiently. Follow these simple steps:
- Step 1: Prepare your Data
- Step 2: Select your Data
- Step 3: Open the Pivot Table Tool
- Step 4: Choose the Data Source
- Step 5: Configure the Pivot Table
21. What is the purpose of the INDEX-MATCH function?
It is an alternative to VLOOKUP, which is used to look up values in a table.
- INDEX Function =INDEX(array, row_num, [column_num])
- MATCH Function =MATCH(lookup_value, lookup_array, [match_type])
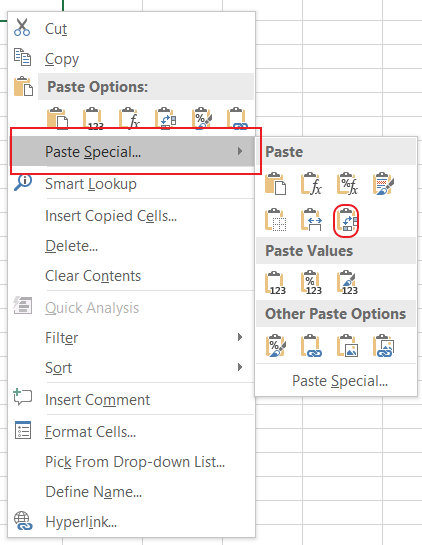
22. How do you transfer data in Excel?
Copy the data, right-click the destination cell, select "Transpose" under "Paste Special."
23. Explain the HLOOKUP function.
The HLOOKUP function is used to search for a value in the first row of a range and returns a value in the same column from another row.
HLOOKUP Function: =HLOOKUP(lookup_value, table_array, row_index_num, [range_lookup])
24. How do you find and replace data in Excel?
Press Ctrl + H to open the Find and Replace dialog box.
25. What is the IF function, and how is it used?
It performs a logical test and returns one value if true and another if false.
IF Function: =IF(logical_test, value_if_true, value_if_false)
26. How do you create a drop-down list in Excel?
Use the Data Validation feature under the "Data" tab.

27. Explain the difference between COUNT, COUNTA, COUNTIF, and COUNTIFS functions.
- COUNT counts the number of cells with numbers. =COUNT(range)
- COUNTA counts non-empty cells. =COUNTA(range)
- COUNTIF counts cells based on a single criterion. =COUNTIF(range, criteria)
- COUNTIFS does the same with multiple criteria.
28. How can you round a number to a specified number of decimal places in Excel?
Use the ROUND function, for example, =ROUND(A1,2) rounds the values in A1 to 2 decimal places.
29. How do you calculate monthly loan payments in Excel?
PMT Function in Excel Calculates the payment for a loan based on constant payments and a constant interest rate.
PMT Function: =PMT(rate, nper, pv, [fv], [type])
Advanced Level Excel Interview Questions
This section includes excel related interview questions designed to test your expertise in handling complex tasks, focusing on complex formulas and tools like PivotTables and VBA. Mastering these questions is crucial for securing roles that demand in-depth Excel knowledge and advanced problem-solving skills.
30. What is VBA in Excel, and how is it used?
VBA (Visual Basic for Applications) is a programming language in Excel used to automate repetitive tasks, create custom functions, analyze data, and interact with other Office apps. It boosts productivity by simplifying complex workflows and enabling advanced functionality.
31. What is a Macro in Excel?
A macro in Excel is a series of pre-recorded commands and instructions designed to automate repetitive tasks. Macros are written using VBA (Visual Basic for Applications) and can be used to save time and enhance efficiency by performing complex operations with a single click.
32. What is the difference between a function and a subroutine in VBA?
| Aspect | Function | Subroutine |
|---|
| Purpose | Returns a value after performing a task. | Performs a task but doesn’t return a value. |
| Syntax | Function Name(args) As DataType | Sub Name(args) |
| Return Value | Yes, via the function name. | No. |
| Usage | For calculations or logical operations. | For procedural tasks like automation. |
| Calling | Used in expressions or formulas. | Called directly by its name. |
| Excel Integration | Can be used as a custom formula in cells. | Cannot be used in Excel cells. |
| Example | result = Add(a, b) | Call DisplayMessage |
33. How do you use the IFERROR function?
It returns a custom result if a formula generates an error; otherwise, it returns the result of the formula.
IFERROR Function: =IFERROR(value, value_if_error)
34. What is the difference between a line chart and a scatter plot?
- A line chart connects data points with lines
- A scatter plot displays individual data points.
35. How do you use the SUMIF and SUMIFS functions?
SUMIF adds values based on a single criterion. SUMIFS does the same with multiple criteria.
| Aspect | SUMIF | SUMIFS |
|---|
| Criteria | Supports a single condition | Supports multiple conditions |
| Syntax | =SUMIF(range, criteria, [sum_range]) | =SUMIFS(sum_range, criteria_range1, criteria1, ...) |
| Complexity | Simpler, used for one condition | More advanced, used for multiple conditions |
36. How do you create a named range in Excel?
Select the range, go to the "Formulas" tab, and click "Define Name."

37. What is the difference between CONCATENATE and TEXTJOIN functions?
TEXTJOIN is a more versatile function that can join text using a specified delimiter and ignore empty cells.
38. How do you use the COUNTBLANK function?
It counts the number of blank cells in a range.
COUNTBLANK: =COUNTBLANK(range)
39. How do you create a macro in Excel?
Go to the "View" tab, click "Macros," select "Record Macro," perform actions and stop recording.

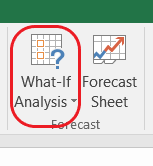
40. How do you create a data table in Excel?
Use the "What-If Analysis" tool in the "Forecast" Group under the "Data" tab.
41. Explain the significance of the ROUND function in Excel.
The ROUND Function rounds a number to a specified number of digits.
42. What is the purpose of the NETWORKDAYS function?
It calculates the number of whole workdays between two dates, excluding weekends and optionally specified holidays.
43. How can you link data between different worksheets?
Use cell references or create formulas that reference cells in other worksheets.
44. Explain the difference between the terms 'filter' and 'sort' in Excel.
- Sorting arranges data in a specified order
- Filtering displays only the data that meets specific criteria.
45. How do you use the AVERAGEIF and AVERAGEIFS functions?
- AVERAGEIF calculates the average based on a single condition.
- AVERAGEIFS does the same with multiple criteria.
46. What is the purpose of the SUBTOTAL function?
It calculates a subtotal in a list or database, ignoring other subtotals.
47. How do you convert text to columns in Excel?
Use the "Text to Columns" feature under the "Data" tab.

48. Explain the importance of the MAX and MIN functions in Excel.
- MAX returns the highest value
- MIN returns the lowest value in a range.
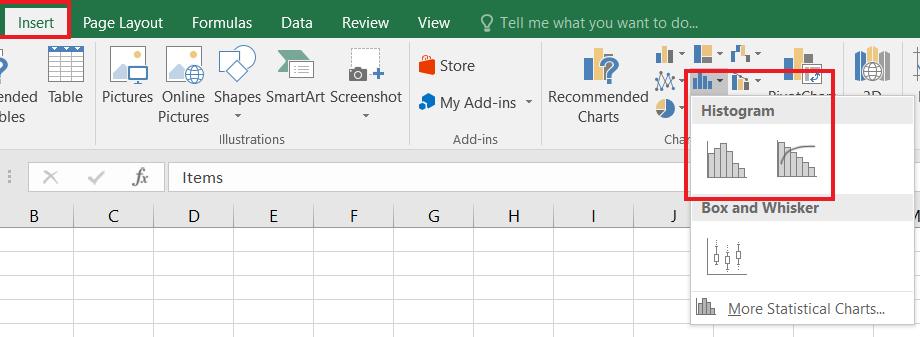
49. How can you create a histogram in Excel?
Use the "Histogram" tool in the "Data Analysis" tool pack.
 MS Excel Toolbar
50. How will you pass arguments to VBA Function?
In VBA, arguments can be passed in two ways:
1. By Value (ByVal): A copy of the variable is passed. Changes inside the function do not affect the original variable.
Function AddByValue(ByVal a As Integer, ByVal b As Integer) As Integer
a = a + 5 ' Original 'a' remains unchanged.
AddByValue = a + b
End Function
2. By Reference (ByRef): A reference to the variable is passed. Changes inside the function affect the original variable.
Function AddByReference(ByRef a As Integer, ByRef b As Integer) As Integer
a = a + 5 ' Original 'a' is modified.
AddByReference = a + b
End Function
Key Difference:
- ByVal: Original variable is unchanged.
- ByRef: Original variable is modified.
By default, VBA passes arguments ByRef unless ByVal is explicitly specified.
51. How do you find the last row in VBA?
The last row is typically determined by locating the last non-empty cell in a column.
Dim lastRow As Long
lastRow = Worksheets("Sheet1").Cells(Rows.Count, 1).End(xlUp).Row
Explanation:
- Rows.Count: Returns the total number of rows (usually 1048576 in Excel 2010+).
- Cells(Rows.Count, 1): Selects the last cell in column A.
- .End(xlUp): Moves up to the last non-empty cell in column A.
- .Row: Retrieves the row number.
52. How do you find the last column in VBA?
The last column is determined by locating the last non-empty cell in a row.
Dim lastCol As Long
lastCol = Worksheets("Sheet1").Cells(1, Columns.Count).End(xlToLeft).Column
Explanation:
- Columns.Count: Returns the total number of columns (usually 16384 in Excel 2010+).
- Cells(1, Columns.Count): Selects the last cell in row 1.
- .End(xlToLeft): Moves left to the last non-empty cell in row 1.
- .Column: Retrieves the column number.
53. How to Find the Last Row and Last Column in VBA?
To find both the last row and column in a used range:
Dim lastRow As Long, lastCol As Long
With Worksheets("Sheet1").UsedRange
lastRow = .Rows(.Rows.Count).Row
lastCol = .Columns(.Columns.Count).Column
End With
Explanation:
- UsedRange: Refers to the range of cells containing data.
- .Rows(.Rows.Count).Row: Gets the last row of the used range.
- .Columns(.Columns.Count).Column: Gets the last column of the used range.
54. Write a VBA Function to Calculate the Area of a Triangle.
VBA Function to find the area of the triangle:
Function TriangleArea(Base As Double, Height As Double) As Double
TriangleArea = 0.5 * Base * Height
End Function
55. Write a VBA Function to Check if a Number is Even or Odd.
VBA Function to check whether the number is odd or even:
Function IsEven(Number As Integer) As Boolean
IsEven = (Number Mod 2 = 0)
End Function
56. Write a VBA Function to Calculate the Sum of Elements in an Array.
VBA Function to Calculate the SUM of Elements in an Array
Function ArraySum(arr As Variant) As Double
Dim i As Integer, Total As Double
Total = 0
For i = LBound(arr) To UBound(arr)
Total = Total + arr(i)
Next i
ArraySum = Total
End Function
57. How do you debug VBA code in Excel?
To debug VBA code step by step, you can use the F8 key. Alternatively, you can set a breakpoint to pause the execution at a specific point. When debugging, the code will execute line by line starting from the beginning. Each time you press F8, the next line is executed. The highlighted line and yellow arrow indicate the current line being executed. This process continues until the code reaches the end.
Excel Interview Questions for Data Analysts
58. What are Pivot Tables, and how do you use them for data analysis?
Pivot Tables are a powerful feature in Excel that allow you to quickly summarize, analyze, explore, and present large sets of data.
- Data Summarization: Pivot Tables make it easy to aggregate data by categories or groups. For example, you can sum up sales by product, region, or any chosen field.
- Data Filtering: You can filter data to focus on specific values or conditions using slicers and filters directly in the Pivot Table.
- Custom Grouping: Group data by time periods, categories, or other custom criteria to reveal trends or patterns that may not be immediately obvious.
- Dynamic Updates: When the source data changes, Pivot Tables can be refreshed to provide updated analysis instantly.
- Data Comparison: You can compare data across different fields (e.g., comparing monthly sales figures or performance metrics between departments).
- Sorting and Ranking: Pivot Tables allow you to sort and rank data in descending or ascending order, helping to identify top performers or outliers.
59. How would you handle missing or inconsistent data in a dataset using Excel?
To handle missing or inconsistent data in a dataset using Excel, follow these steps:
- Identify missing data using features like filters, conditional formatting, or the COUNTBLANK function.
- Fill missing values by using methods such as filling with the average, median, or previous value, depending on the context.
- Remove incomplete rows if they don’t impact the analysis or if filling values is not feasible.
- Standardize data formats using tools like TEXT, UPPER, TRIM, or other string functions to correct inconsistencies.
- Use Data Validation to prevent inconsistent or incorrect data entry.
- Remove duplicates using the “Remove Duplicates” feature to ensure data integrity.
This approach ensures data accuracy, consistency, and reliable analysis.
The Data Analysis Toolpak in Excel provides a suite of statistical analysis tools for performing complex data analysis quickly and easily. To use it, you must first enable the Toolpak by navigating to File > Options > Add-ins, selecting Excel Add-ins, and checking the box for Analysis Toolpak.
Once enabled, you can access it from the Data tab under Data Analysis. The Toolpak offers functions like:
- Descriptive Statistics to summarize data with mean, median, mode, variance, and standard deviation.
- Regression Analysis to evaluate relationships between variables.
- Histograms for frequency distribution analysis.
- ANOVA for comparing means across multiple groups.
- t-tests and other hypothesis testing tools for statistical significance evaluation.
You select the desired analysis type, provide input ranges, and Excel generates results in a new worksheet, helping you derive meaningful insights efficiently.
61. What are some limitations of Excel when it comes to large data analysis? How do you overcome them?
Excel Limitations for Large Data Analysis:
- Size Limits: Maximum of 1,048,576 rows and 16,384 columns.
- Performance Issues: Large datasets may cause slowdowns or crashes.
- Complex Relationships: Limited support for complex data models.
- Data Accuracy Risks: Prone to manual errors.
- Limited Automation: Basic automation compared to other tools.
Solutions:
- Use Power Query/Power Pivot for efficient data processing.
- Split Data or use external databases (e.g., SQL).
- Summarize Data with Pivot Tables and formulas.
- Use Other Tools like Python, R, or Power BI for larger datasets.
- Data Validation to reduce errors.
Conclusion
Mastering Excel is crucial for professionals across various industries, and preparing for excel interview questions is key to securing a job that involves data handling and analysis. In this guide, we covered both basic and advanced excel related interview questions to help you succeed. Whether you're a fresher or an experienced candidate, understanding the questions asked about Excel in an interview will ensure you're well-prepared. Practice these excel questions asked in interviews, and you're sure to impress potential employers with your knowledge.
By focusing on key Excel functions and features, you’ll be ready to answer any excel related interview questions confidently, showcasing your skills to potential employers.
Excel Interview Questions and Answers - FAQs
What are the Five Basic Excel Functions?
The five basic Excel Functions are:
- The VLOOKUP Function.
- The Concatenate Function.
- Text to Columns.
- Remove Duplicates.
- Pivot Tables.
The 5 Basic Excel Formulas are:
- =SUM(C2:C5)
- =MIN(E2:E5)
- =MAX(E2:E5)
- =AVERAGE(C2:C5)
- =COUNT(E2:E5)
How do I prepare for an Excel Interview?
Prior to the interview, engage in practicing various Excel tasks.
Get ready to respond to common interview inquiries.
Review and update your resume along with other application documents.
What is Excel basic questions?
Some of the basic Excel questions are:
- What is Microsoft Excel?
- What are the basic components of Excel?
- How do you enter data into Excel?
- What is a formula in Excel?
- How can you save an Excel document?
A formula bar is that toolbar in Excel that is situated just beneath the Ribbon and above the Spreadsheet Grid.