


Industry Research


Business Outlook Diverges for Design and Construction Pros
See how expectations and project backlogs differ among remodeling sectors, per the Q4 2023 Houzz Renovation Barometer

Architecture and design pros report having had increased business activity in the second quarter and being optimistic about business through the end 2023. But more professionals in the construction sector report declines in the third quarter of 2023 business activity than improvements, leading to a somewhat unfavorable outlook for the fourth quarter, even with increased project backlogs. Those are the key takeaways from the just-released Q4 2023 Houzz Renovation Barometer, which provides timely insights into the impact of recent economic volatility on the home improvement market.
“Following improved Q3 business activity, architecture and design professionals are relatively optimistic about business through the end of the year,” Houzz staff economist Marine Sargsyan says. “However, as business activity continues to slow in the construction sector, build-only professionals in particular have a more negative perspective about activity through the end of the year. Despite this outlook, activity continues and backlogs remain at least one week longer than they were last year for the construction sector.”
“Following improved Q3 business activity, architecture and design professionals are relatively optimistic about business through the end of the year,” Houzz staff economist Marine Sargsyan says. “However, as business activity continues to slow in the construction sector, build-only professionals in particular have a more negative perspective about activity through the end of the year. Despite this outlook, activity continues and backlogs remain at least one week longer than they were last year for the construction sector.”
A score higher than 50 indicates that more firms have reported an increase in their business expectations than have reported a decrease.
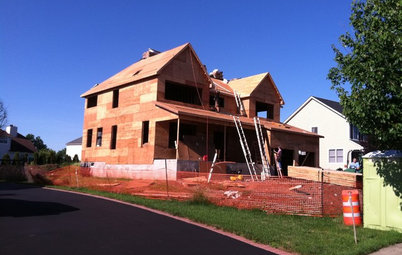
Construction Firms
1. Business activity expectations have decreased. The Expected Business Activity Indicator, related to project inquiries and new committed projects, declined to 47 for Q4 (compared with 54 in Q3), which indicates that more businesses expect a quarter-over-quarter decline than a quarter-over-quarter increase. Expectations for project inquiries decreased to 46, compared with 54 in Q3, and new committed projects are at 47, down by 6 points relative to Q3 expectations (53).
However, expectations diverge between design-build firms and build-only remodelers. Design-build firms are more optimistic, with an Expected Business Activity indicator of 53 points — meaning that more businesses anticipate growth than decline. Build-only remodelers anticipate slower activity than they did in the previous quarter (41 in Q4 compared with 54 in Q3).
The indicator is based on survey questions about whether businesses expect the number of project inquiries and new projects to increase, decrease or remain unchanged in the coming three months compared with the previous three months.
How to Make the Most of Those Quieter Periods
2. Project backlogs are slightly longer than they were a year ago. The average backlog across the construction sector is 11.4 weeks, up by almost a week (0.9) compared with the same period last year, when it was 10.5 weeks. It’s also 5.1 weeks longer than five years ago, in Q4 2018.
For the construction sector, the West North Central division (including Iowa, Kansas, Minnesota, Missouri, Nebraska, North Dakota and South Dakota) has the longest backlog (15.1 weeks), driven by build-only firms (18.3 weeks) and design-build firms (12 weeks).
Businesses in the East South Central division (including Alabama, Kentucky, Mississippi and Tennessee) report an average backlog of 5 weeks — the shortest among construction firms in the nine Census divisions.
Compared with the same quarter one year ago, backlogs for the construction sector are longer across five of the nine Census divisions (all but the East North Central, East South Central, Middle Atlantic and West South Central divisions).
Boost Your Business With These Winter Prep Ideas for Clients
A score lower than 50 indicates that more firms have reported a decrease in their recent business activity than have reported an increase.
3. Slight improvement in business activity. For Q3, the Recent Business Activity Indicator related to project inquiries and new committed projects is at 44, up by 1 point from Q2. This is driven by a 4-point increase in project inquiries in Q3 and a 3-point decrease in new committed projects, to 44, in Q3 relative to Q2.
The Recent Business Activity Indicator looks at actual activity over the previous three months. In contrast with the Expected Business Activity and Project Backlog indicators, which look forward in time, the Recent Business Activity Indicator looks back. It’s based on survey questions about whether businesses observed an increase, a decrease or no change in the actual number of project inquiries and new committed projects over the previous three months relative to the three months before that.
These Are the Bathroom Styles and Features Homeowners Want Now
A score higher than 50 indicates that more firms have reported an increase in their business expectations than have reported a decrease.
Architectural and Design Firms
1. Business activity expectations have increased. Positive sentiment among the architectural and design services sector is significantly stronger for Q4 (at 61) than it was for the previous quarter (52); more firms expect business activity to improve than to slow down. Both interior designers and architects report improved Q3 business activity, though interior designers (64) are somewhat more optimistic than architects (59) that business growth will continue.
The Expected Business Activity Indicator related to project inquiries and new committed projects has increased to 61 for Q4 (up by 9 points from Q3). The increase is driven primarily by a 9-point increase in expectations for both project inquiries and new committed projects, to 61 each in Q4.
2. Wait times are shorter than they were a year ago. The Project Backlog Indicator for the architectural and design services sector is 6.1 weeks for the beginning of Q4. The average backlog is down by one and a half weeks compared with last year, when it was 7.6 weeks, but is a week longer than it was five years ago, in Q4 2018 (5.1 weeks).
Learn about Houzz Pro software
Learn about Houzz Pro software
Backlogs also vary across all regional divisions among businesses in the architectural and design services sector. Businesses in the Middle Atlantic division (New York, New Jersey and Pennsylvania) report an average backlog of 8.3 weeks.
The West South Central division (including Arkansas, Louisiana, Oklahoma and Texas) had a much shorter average backlog, 4.4 weeks. Backlogs reported by architects in the Middle Atlantic division (10.2 weeks on average) are the driving force for long wait times, whereas the average wait to begin a new project with an interior designer in that region is 5.1 weeks.
Compared with the same quarter one year ago, the average backlog for the architectural and design services sector is longer across only two of the nine Census divisions (Middle Atlantic and South Atlantic divisions).
A score lower than 50 indicates that more firms have reported a decrease in their recent business activity than have reported an increase.
3. Recent business activity has increased significantly. Following a continuous decline over eight consecutive quarters, the overall Recent Business Activity Indicator related to project inquiries and new committed projects for the architectural and design services sector is up for the second quarter in a row, to 52, in Q3 — a significant increase from 43 in Q2. Interior designers are at 55 versus architects at 51, indicating that more businesses in both groups experienced an improvement in business activity than experienced a slowdown.
Recent project inquiries increased significantly, to 50, and new committed projects increased to 55 in Q3 (up 10 and 9 points, respectively, compared with Q2).
The Houzz Renovation Barometer is based on a quarterly online survey sent to a national panel of U.S. businesses with online profiles on Houzz. If you’re a pro and you would like to offer your insights on market conditions in your area by joining the Barometer panel, please click here.
Read more on this and past Barometer reports (including more detailed subsector and regional data).
Tell us: We’d love to hear how this report compares with your experiences as a pro or as a homeowner. Please share in the Comments.
More on Houzz
Read more stories about remodeling trends
Learn about Houzz Pro software
Talk with your peers in Pro-to-Pro discussions
Join the Houzz Trade Program


Let’s take a look at what remodeling and design industry professionals are saying about residential renovation market conditions.
See how Houzz Pro can help you find customers, manage projects and grow your business