The Growth and the Optical, Mechanical, Dielectric and Photoconductivity Properties of a New Nonlinear Optical Crystal—L-Phenylalanine-4-nitrophenol NLO Single Crystal ()
1. Introduction
Recently, a very novel approach has been adopted for obtaining new materials for non linear optics. The fast development in the field of optoelectronics necessitates the search for new and efficient nonlinear optical (NLO) materials, which can be utilized for many applications such as optical communications, optical data storage, optical computing and electro-optic shutters [1]. Among nonlinear optical crystals, organic salts occupy an intermediate position between molecular organic compounds with covalent bonds and inorganic compounds with mainly ionic bonds [2]. The design and synthesis of organic molecules exhibiting nonlinear optical properties have been motivated by their potential for applications in optical communications, optical computing, data storage, dynamic holography, harmonic generators, frequency mixing, and optical switching [3,4]. In the present work, the L-phenylalanine-4-nitrophenol single crystal has been grown by slow evaporation technique and the cell parameters calculated using the single crystal XRD. The mechanical behaviour was analyzed using Vicker’s microhardness test. The dielectric constant and dielectric loss measurements were taken at different temperatures and frequencies. The photoconductivity studies reveal that the crystal shows negative the photoconductive nature of the L-phenylalanine-4-nitrophenol single crystal.
2. Experimental Details
L-phenylalanine-4-nitrophenol single crystals were synthesized by dissolving L-phenylalanine and 4-nitrophenol in the molar ratio of 1:1 in distilled water. The solution was stirred continuously using a magnetic stirrer. The prepared solution was filtered and kept undisturbed at room temperature. Tiny seed crystals with good transparency were obtained, due to spontaneous nucleation. Among them, defect free seed crystal was suspended in the mother solution, which was allowed to evaporate at room temperature. Large size single crystals were obtained, due to the collection of monomers at the seed crystal sites from the mother solution.
3. Results and Discussion
3.1. Single Crystal XRD
The single crystal XRD analysis for the grown crystals has been carried out to identify the lattice parameters. The calculated lattice parameters are; a = 5.84 Ǻ, b = 7.01 Ǻ, c = 17.87 Ǻ and volume of the crystal V = 728.32 Ǻ3. The crystal has a monoclinic crystal structure with space group P21. These values have good agreement with the reported values [5].
3.2. UV-Visible Spectroscopy
The optical absorption of the crystal is an important factor for analyzing the second harmonic generation property. Hence, the grown crystal was subjected to UVVIS-NIR absorption studies. The absorption of the present L-phenylalanine-4-nitrophenol crystal was in the range of 250 nm to 2000 nm; the corresponding spectrum is shown in Figure 1. From the absorption spectrum, the lower cut-off wavelength is found to be 320 nm and the lower percentage absorption indicates that the crystal readily allows the transmission of the laser beam in 250 nm and 2000 nm. It shows that the grown crystal has a good transparency in UV, visible and near IR region (i.e., for the entire wavelength range studied) indicating that it can be used for NLO applications. The measured transmittance (T) was used to calculate the absorption coefficient (α) using the formula
 (1)
(1)
where t is the thickness of the sample. The optical band gap (Eg) was evaluated from the transmission spectrum and optical absorption coefficient (α) near the absorption edge was calculated using the formula [6].
 (2)
(2)
where A is a constant, Eg the optical band gap, h the Planck constant and n the frequency of the incident photons. The band gap of the L-phenylalanine-4-nitrophenol crystal was estimated by plotting (ahv)1/2 versus hv as shown in Figure 2 and extrapolating the linear portion near the onset of absorption edge to the energy axis. From the figure, the value of the band gap was found to be 3.87 eV. This high band gap value indicates that the grown crystal possesses dielectric behavior to induce polarization when powerful radiation is incident on the material. The extinction coefficient (K) can be obtained from the equation,
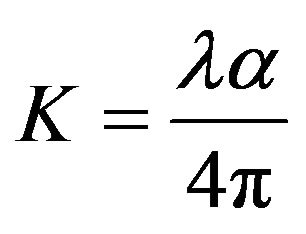 (3)
(3)

Figure 1. Transmission spectrum of L-phenylalanine-4- nitrophenol crystal.
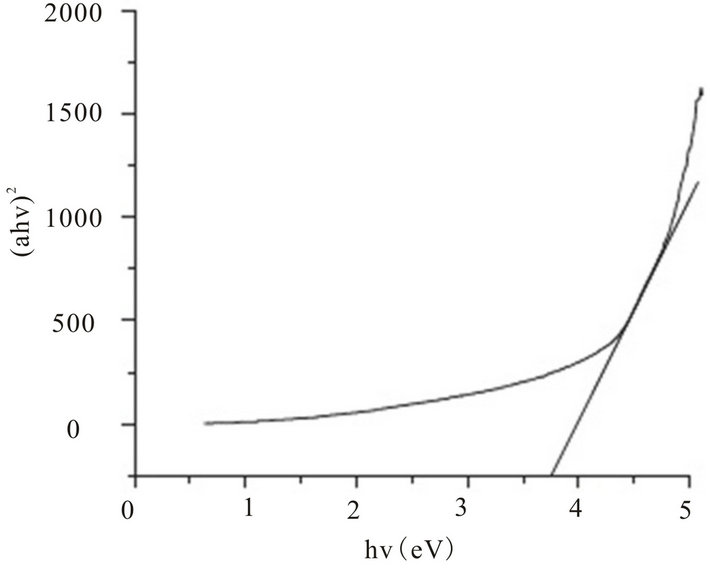
Figure 2. Plot of (αhυ)2 versus hυ for L-phenylalanine-4- nitrophenol single crystal.
The transmittance (T) is given by
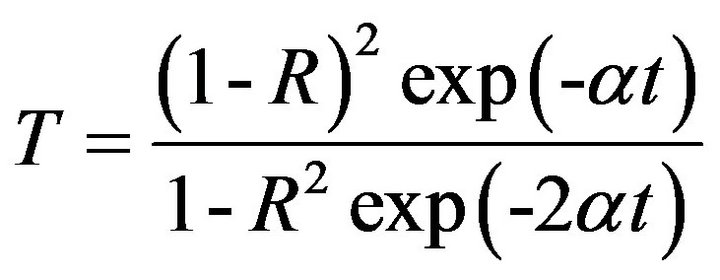 (4)
(4)
The reflectance (R) in terms of the absorption coefficient can be obtained from the above equation.
Hence,
 (5)
(5)
Refractive index (n) can be determined from the reflectance data, using the following equation,
 (6)
(6)
The refractive index (n) is 1.36 at λ = 2000 nm. From the optical constants, the electric susceptibility (χc) can be calculated according to the following relation [7].
 (7)
(7)
Hence,
 (8)
(8)
The value of electric susceptibility χc is 0.152 at λ = 2000 nm. The real part dielectric constant εr and the imaginary part dielectric constant εi can be calculated from the following relations [8],
 &
&  (9)
(9)
The values of the real εr and εi imaginary dielectric constants at λ = 2000 nm are 1.26 and 5.204 × 10⁻⁵ respectively.
3.3. Microhardness Test
The microhardness studies were carried out on the as grown crystal of L-phenylalanine-4-nitrophenol using the Shimadzu HMV-2000 Microhardness tester. To evaluate the Vickers microhardness, several indentations were made on the smooth surface of the crystal. The Vicker’s microhardness number was evaluated using the relation,
 (10)
(10)
where HV is the Vicker’s micro hardness number, P is the applied load and d the average diagonal length of the indentation impression. The dependence of the micro hardness on the load for the L-phenylalanine-4-nitrophenol crystal has been calculated and shown in Figure 3. The indentation was made on the sample with the load ranging from 10 - 50 g and the indentation time was kept constant as 10 s. The Figure 3 indicates that the microhardness number increases with increasing load. The work hardening coefficient value (n) of the grown crystal would be n > 2. Hence, the L-phenylalanine-4-nitrophenol crystal is a soft material.
3.4. Dielectric Properties
The study of the dielectric constant of a material gives an outline about the nature of atoms, ions and their bonding in the material. From the analysis of the dielectric constant and dielectric loss as a function of frequency and temperature, the different polarization mechanism in solids can be understood. Variations in the dielectric constant and dielectric loss as functions of temperatures and frequencies are shown in Figures 4 & 5. The dielectric constant and the dielectric loss of the L-phenyla lanine-4-nitrophenol crystal were studied at different

Figure 3. Vickers hardness profile of L-phenylalanine-4-nitrophenol as a function of applied load.

Figure 4. Variation of dielectric constant of L-phenylalanine-4-nitrophenol with log frequency.

Figure 5. Variation of dielectric loss of L-phenylalanine-4- nitrophenol with log frequency.
temperatures using the HIOKI 3532 LCR HITES-TER in the frequency region of 50 Hz to 5 MHz.The dielectric constant was measured as a function of frequency at different temperatures of 30˚C, 60˚C, 90˚C, and 120˚C and is shown in Figure 4, while the corresponding dielectric losses are depicted in Figure 5. The dielectric constant is evaluated using the relation,
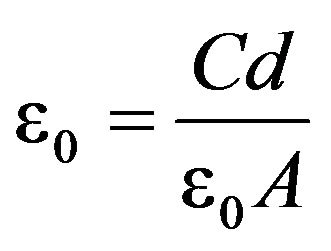 (11)
(11)
where d is the thickness of the sample, A, the area of the sample. Figure 4 shows the plot of the dielectric constant (ε) versus log frequency for 30˚C, 60˚C, 90˚C, and 120˚C. It is seen that the value of the dielectric constant is high in the lower frequency region for all the temperatures and then it decreases with an increase in the frequency. The high value of the dielectric constant in the low frequency region is attributed to space charge polarization, due to the charged lattice defects [9]. The large values of the dielectric constant at low frequency suggest that there are contributions from the electronic, ionic, dipolar, and space charge polarizations. Space charge polarization is generally active at lower frequencies and high temperatures and indicates the perfection of the crystals. Further space charge polarization will depend on the purity and perfection of the material. Its influence is large at higher temperatures and is noticeable in the low frequency [10]. A graph is drawn between the dielectric loss and log frequency for different temperatures (30˚C, 60˚C, 90˚C and 120˚C) and is shown in Figure 5. The low value of dielectric loss at high frequency suggests that the grown crystals possess good optical quality. This parameter is of vital importance for nonlinear optical materials in their applications [10].
3.5. Photoconductivity Studies
Photoconductivity studies have been carried out using the Keithley 485 picoammeter instrument. The dark current was recorded by keeping the crystal unexposed to any radiation. Figure 6 shows the variation of both the dark current and photocurrent with applied field at different levels of illumination. The required current is noted for varying applied fields. It is seen from the plots that both dark current and photocurrent of the sample increase linearly with the applied field. The dark current is seen to be higher than the photocurrent for the same applied field, which is termed as negative photoconductivity. The negative photoconductivity exhibited by the sample may be due to the reduction in the number of charge carriers in the presence of radiation. The decrease in the mobile charge carriers during negative photoconductivity can be explained by the Stockmann model [11].The negative photoconductivity in a solid is due to the decrease in the
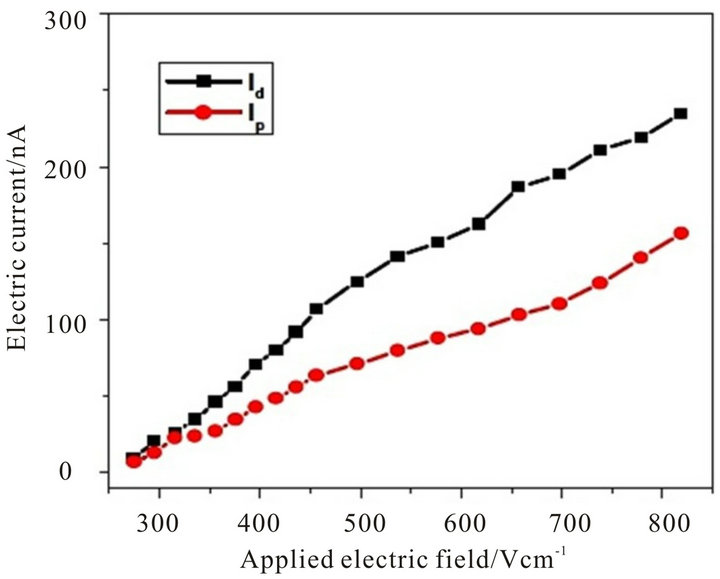
Figure 6. Field dependence of dark and photocurrents.
number of charge carriers or their lifetime, in the presence of radiation [12]. For a negative photoconductor, the forbidden gap holds two energy levels in which one is placed between the Fermi level and the conduction band while the other is located close to the valence band. The second state has a higher capture cross-section for electrons and holes. As it captures electrons from the conduction band and holes from the valence band, the number of charge carriers in the conduction band gets reduced and the current decreases in the presence of radiation.
4. Conclusion
Single crystals of L-phenylalanine-4-nitrophenol have been grown from an aqueous solution by the slow evaporation technique. The grown single crystals have been characterized by the single crystal XRD and it is confirmed that the crystal belongs to the monoclinic system, with space group P21. The optical band gap (Eg), absorption coefficient (α), extinction coefficient (K), refractive index (n), electric susceptibility χc and dielectric constants were calculated. The mechanical strength of the grown crystal was found from the Vicker’s microhardness measurement. Dielectric studies have been carried out to examine the dielectric constant and dielectric loss at different frequencies and different temperatures. The photocurrent was less than the dark current, signifying a negative photoconducting nature.