-
Notifications
You must be signed in to change notification settings - Fork 165
New issue
Have a question about this project? Sign up for a free GitHub account to open an issue and contact its maintainers and the community.
By clicking “Sign up for GitHub”, you agree to our terms of service and privacy statement. We’ll occasionally send you account related emails.
Already on GitHub? Sign in to your account
ggsurvplot(): Plotting multiple surv objects on the same graph #195
Comments
|
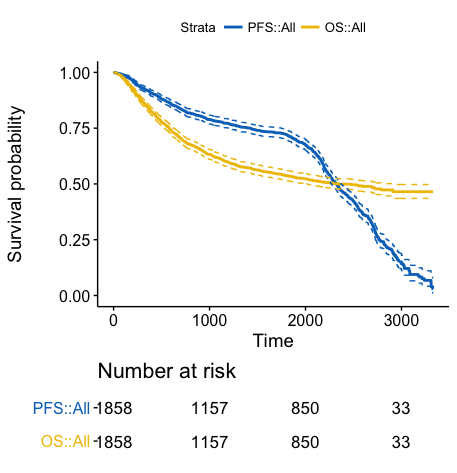
New option Load required packagesCreate a demo data setEx1: Combine null models
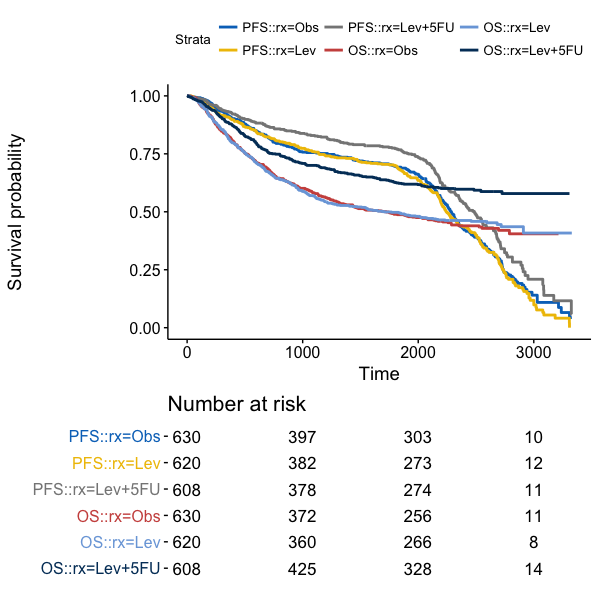
Ex2: Combine stratified curves
|
|
Does this also work with ggflexsurvplot? |
|
I would like to do the same but with data from different sources. So my |
I am in the same situation also. I just had to create a merged data.frame from the different sources to achieve a work around |
|
Thanks for the post! It was really helpful but can we show the median survival time with the use of surv.median.line which is available in ggsurvplot when we combine the graphs? I tried it but couldn't get the median survival line. Please suggest me an option for the same . Thank you |
|
I want to do the same but combine an exponential survival curve with a Weibull in the same graph. Any idea how to do it? |
|
I am trying to combine 3 null models in one graph, but it doesn't work. Ex1: Combine 3 null models Combine three survival curves on one graph: |


(User request by-email)
In oncology, we wish to plot time on treatment, progression free survival and overall survival on the same graph (and often also stratified by treatment assignment).
A simple solution to add multiple surv object on the same graph wanted.
The R code to generate this type of plot would look like this:
The plot would look like this:
The text was updated successfully, but these errors were encountered: