A new measurement tool that uses light detection and ranging (or LiDAR) can show how earthquakes have changed the landscape down to a few inches—and that can help us prepare for difficult-to-predict earthquakes.
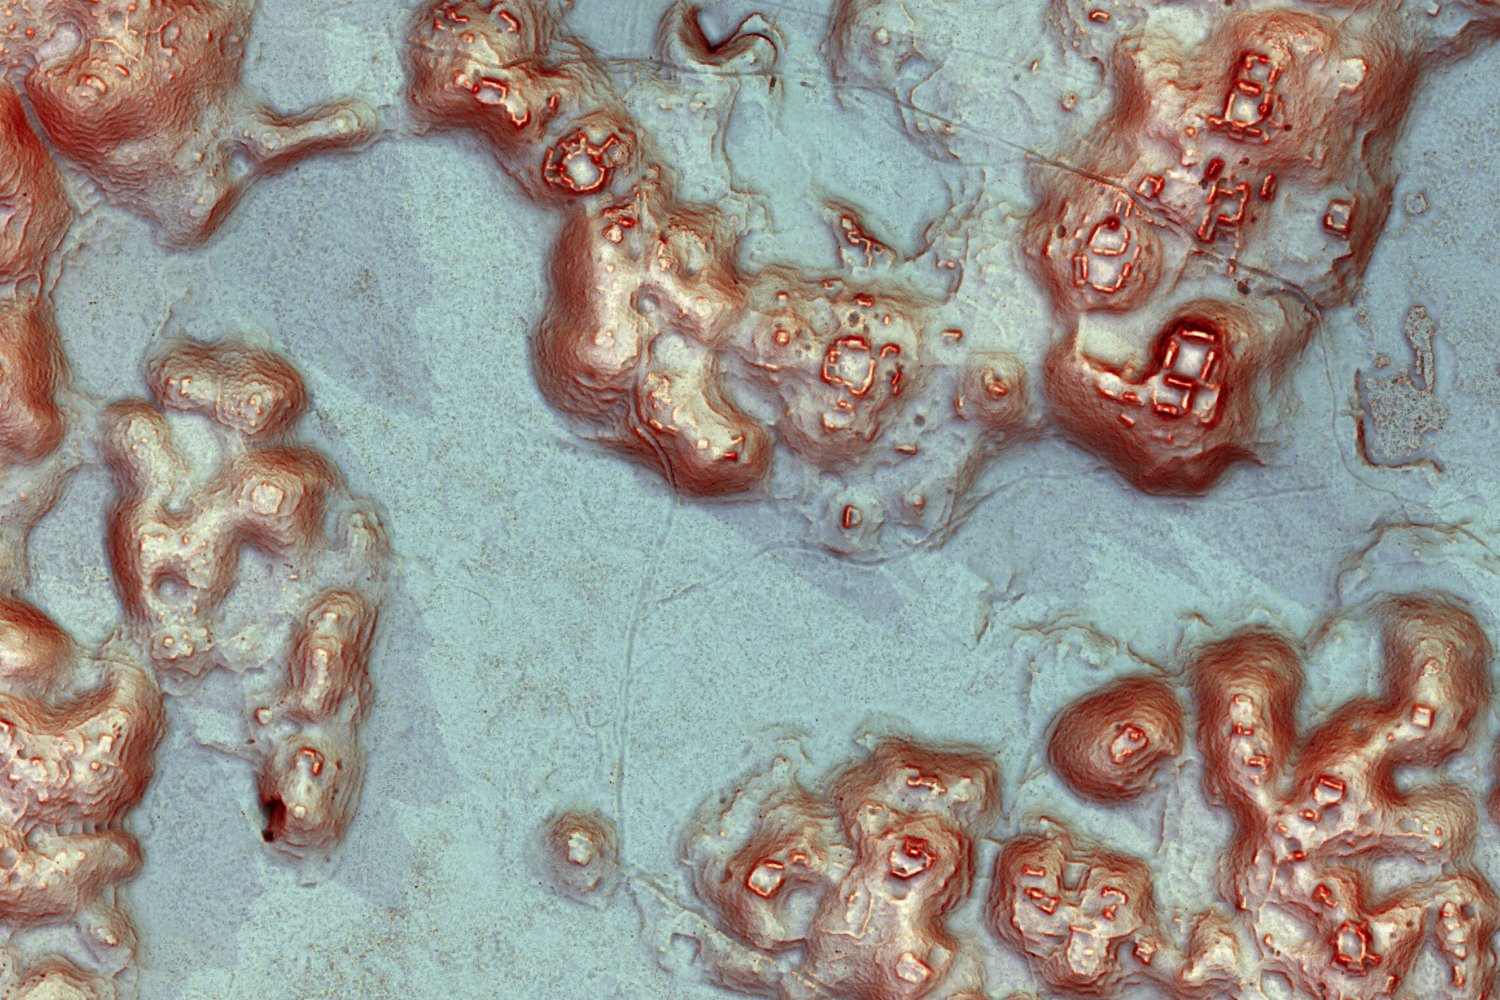
In the image above, blue means the earth has descended, and red shows upward movement compared to a 2006 survey. LiDAR makes an image like that possible by bouncing a stream of laser pulses off the ground from an aircraft to quickly collect measurements. For this study, scientists from the United States, Mexico and China over a period of just three days scanned about 140 square miles effected by the the magnitude 7.2 tremor in northern Mexico in April, 2010, which killed four people and injured 100. By comparing that data with records from 2006, they created the most detailed before-and-after image of a post-earthquake zone ever seen. The researchers will publish their work in the Feb. 10 issue of the journal Science.
Such a clear picture is extra important with this type of earthquake, because it didn’t happen on a major fault line, but through a series of several smaller faults. Learning how such areas behave can be a major help with preparation for and reaction to future tremors.
“This sort of earthquake happens out of the blue,” said Michael Oskin, geology professor at the University of California at Davis and lead author on the paper. But with more maps like this one, we could have a little more heads up.
The scientists have now taken “before” LiDAR scans of the San Andreas system and other active faults in the Western United States. So when the next big one hits it might be shitshow, but we’ll have amazing images of it. [Science]
Image: Michael Oskin, UC Davis

